Student Tab:
When you go to the Data Exploration page, you will automatically be directed to the Overview tab. To get the student tab, click the tab that says Students under the filter at the top of the page. Remember to set the filter to the appropriate dates you would like to view.
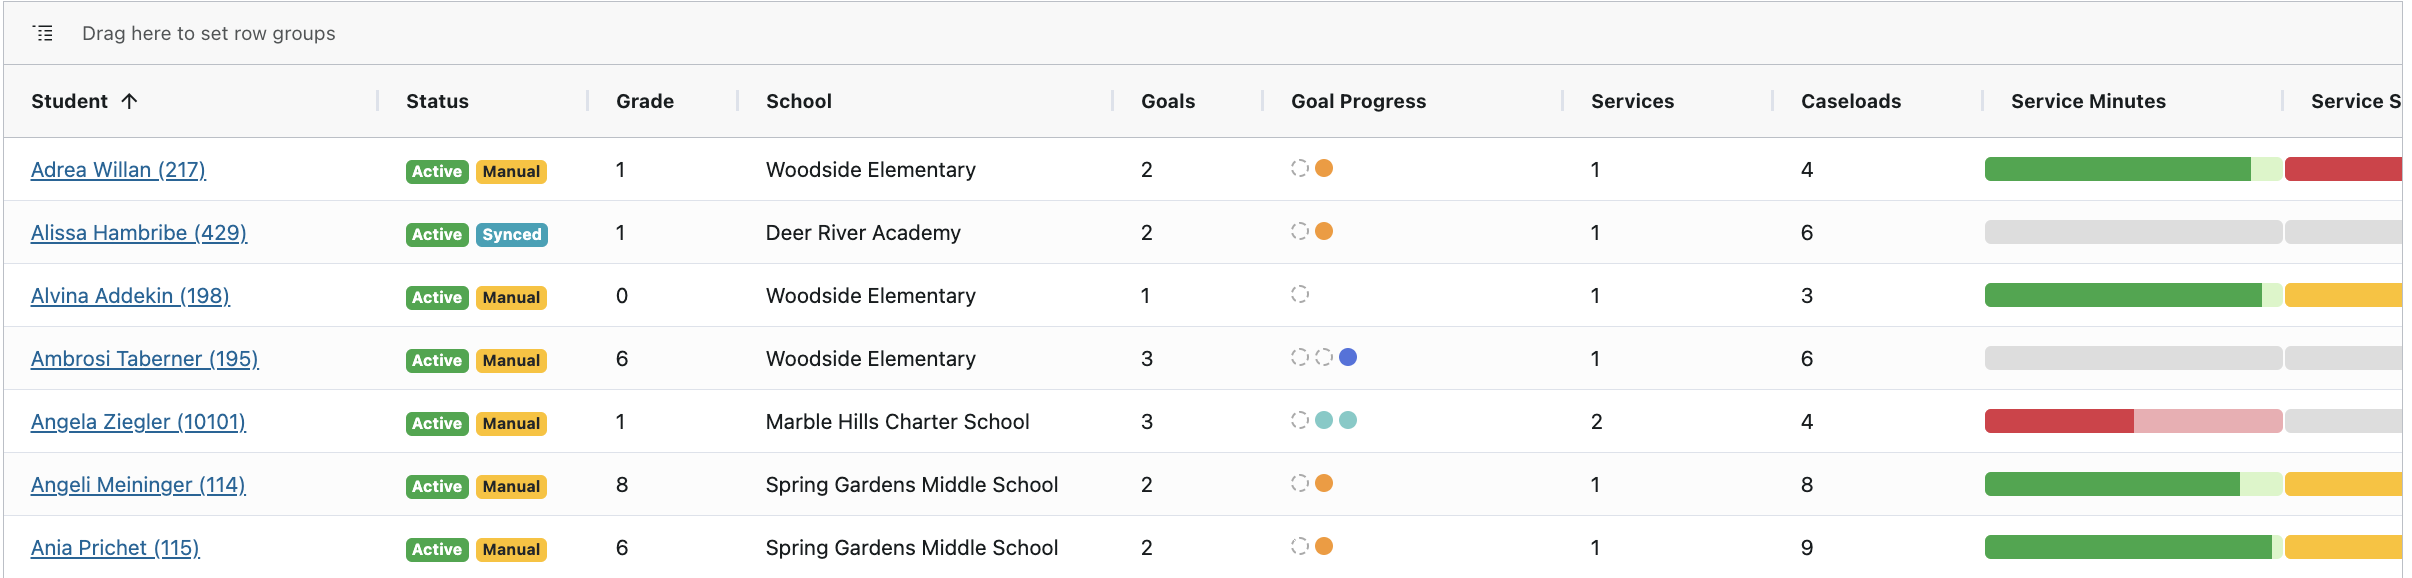
On the student page, you will see high level information for the students on your caseload. To see more detailed information about a student, you can click on their name to see their data profile.
Note: Some data is only available if using the Premier Tier and service fulfillment.
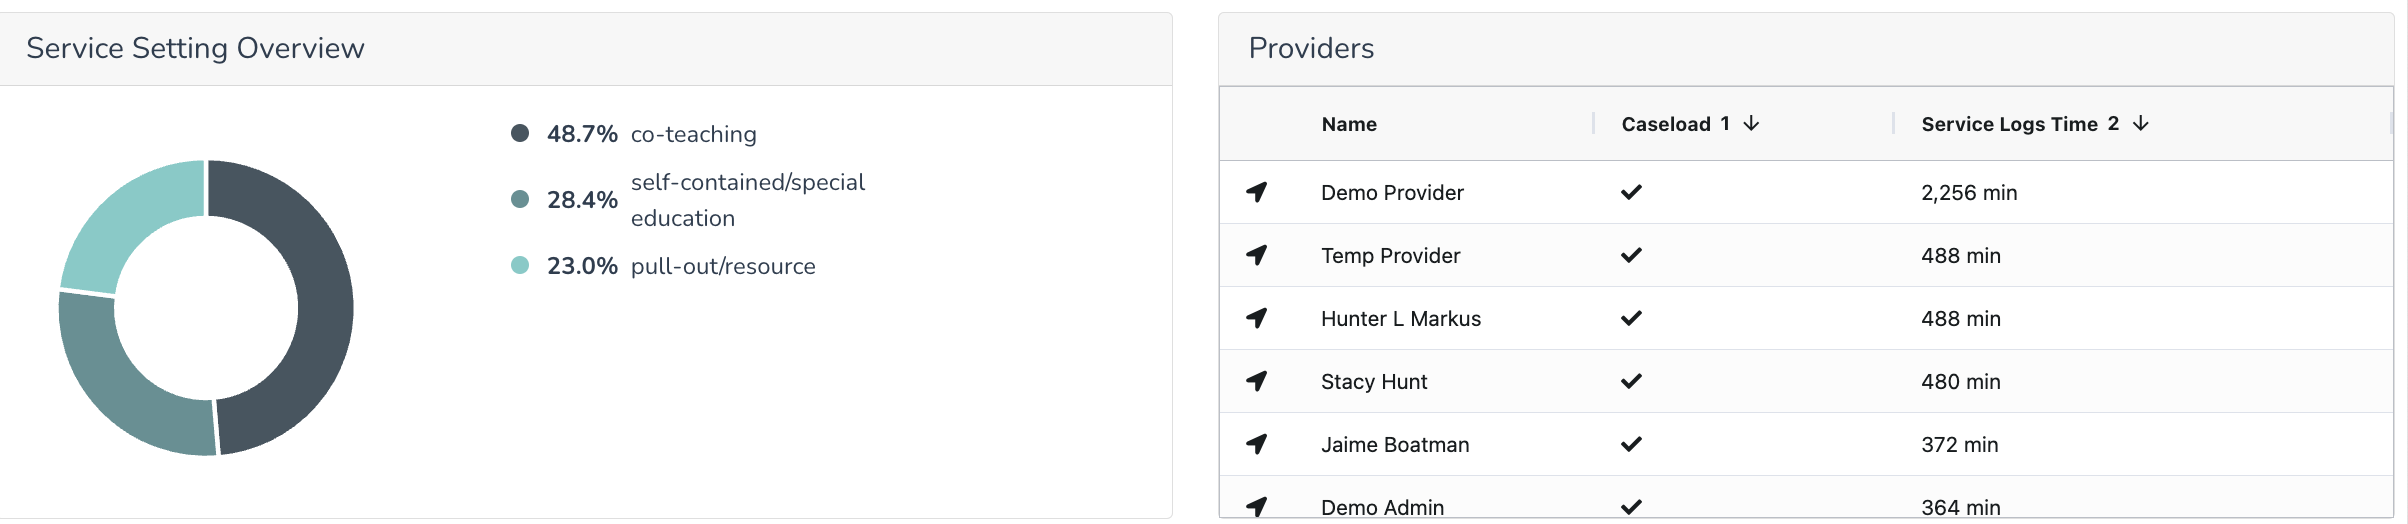
Once you click a student's name, you will see detailed information for that student for the date range selected in the filter. At the top of the page, you will see the service setting overview for this students services.
Next to the services, you will see all providers who have logged minutes for this student in the date range select. If a provider has a check mark under the Caseload column, this will indicate that this student is currently on their caseload.
If you are using Brolly's Premier Tier, next you will see the Services data. If you do not see the Services data, you will see the Goals data next.
Under the Services dashboard, you will see if that student is receiving the correct minutes and frequency of minutes using the two bar graphs. Depending on the dates you select, you may see old services if they were active during the filtered date range.
The service minutes bar graph will show if that student has received the number of expected minutes for the filtered date at the top. These minutes are taken from the service in the students IEP and factored by the date range in the filter. The service session bar will indicate based on the amount and frequency of services if the student received the correct amount of service sessions.

Under Goals, you will see all the students goals that were active in the date range filtered at the top of the page. You will see the information about this goal including the most recent progress, time logged for the goal, start/end date, and number of benchmarks/objective. You will also see a graph below that shows all progress monitoring sessions recorded in this time and the progress submitted. Use the arrow by the goal name to see only that goal in the graph below.
